Disclosure: Aussie Hosting is community-run. We sometimes earn a commission when you buy hosting through our links. Learn more.
Internet Growth Statistics (2025 Update)
 Nathan Finch——Last Updated on March 10, 2025
![]()
![]()
![]()
![]()
![]()
![]()
My name is Nathan and today I put together a huge list of Internet statistics. Some of these are really surprisingly and you might even question their veracity.
We put this list together for no singular purposes and the idea for it actually came from a bet that my friend Eddie and I had. A month later and we put together this great list of Internet stats and facts. Reading through it will give you a MUCH better understanding behind big global Internet trends.
Internet Statistics in 2025

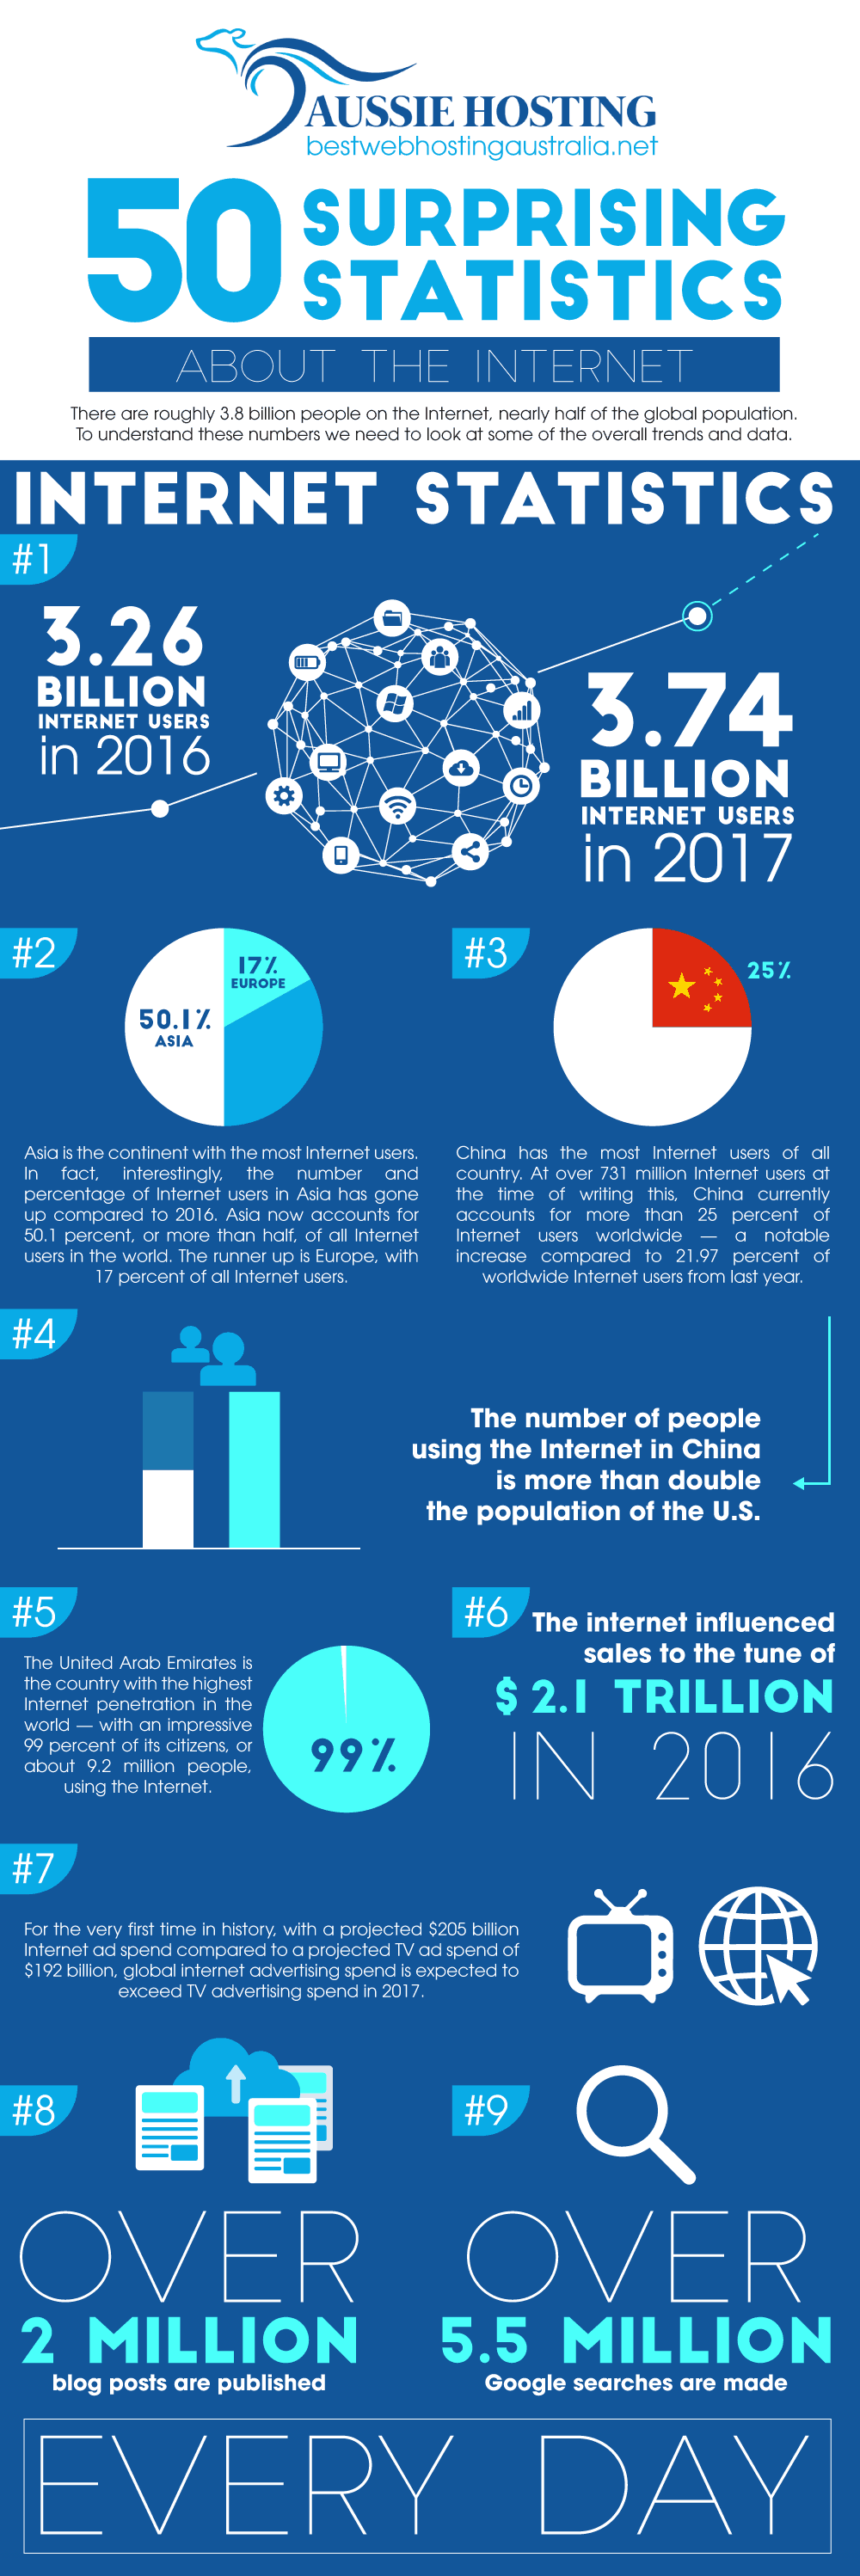
 As of March 2017, there are 3.74 billion people who use the Internet
- This was a 480 million increase in users over 2016
- There are more Internet users in Asia than on any other continent
- This increase is seen numerically and percentage-wise when compared to 2016
- Over 50 percent of worldwide Internet users are in Asia.
- China has more Internet users than any other country
- The 731 million Internet users in China at the time of this writing equals more than 25 percent of all Internet users worldwide.
- This increase is noteworthy considering that China only accounted for 21.97 percent of worldwide Internet users in 2016.
- There are more than twice as many people in China using the Internet as there is population in the United States of America.
- Ninety-nine percent of the people living in the United Arab Emirates, or approximately 9.2 million, people use the Internet. This means that as of 2017, the United Arab Emirates has the world’s highest Internet penetration.
- In 2016 alone, more than $2.1 trillion in sales were influenced by the Internet.
- The year 2017 marks the first year in history where global Internet ad spending (a projected $205 billion) will exceed global television ad spending (a projected $192 billion).
- The number of blog posts published on the Internet exceeds two million daily.
- Each and every day Google searches are performed to the tune of more than 5.5 billion.
- Vue JS is the fastest growing dev framework more than 240,000 websites built with Vue JS
Domain Name Statistics 2025
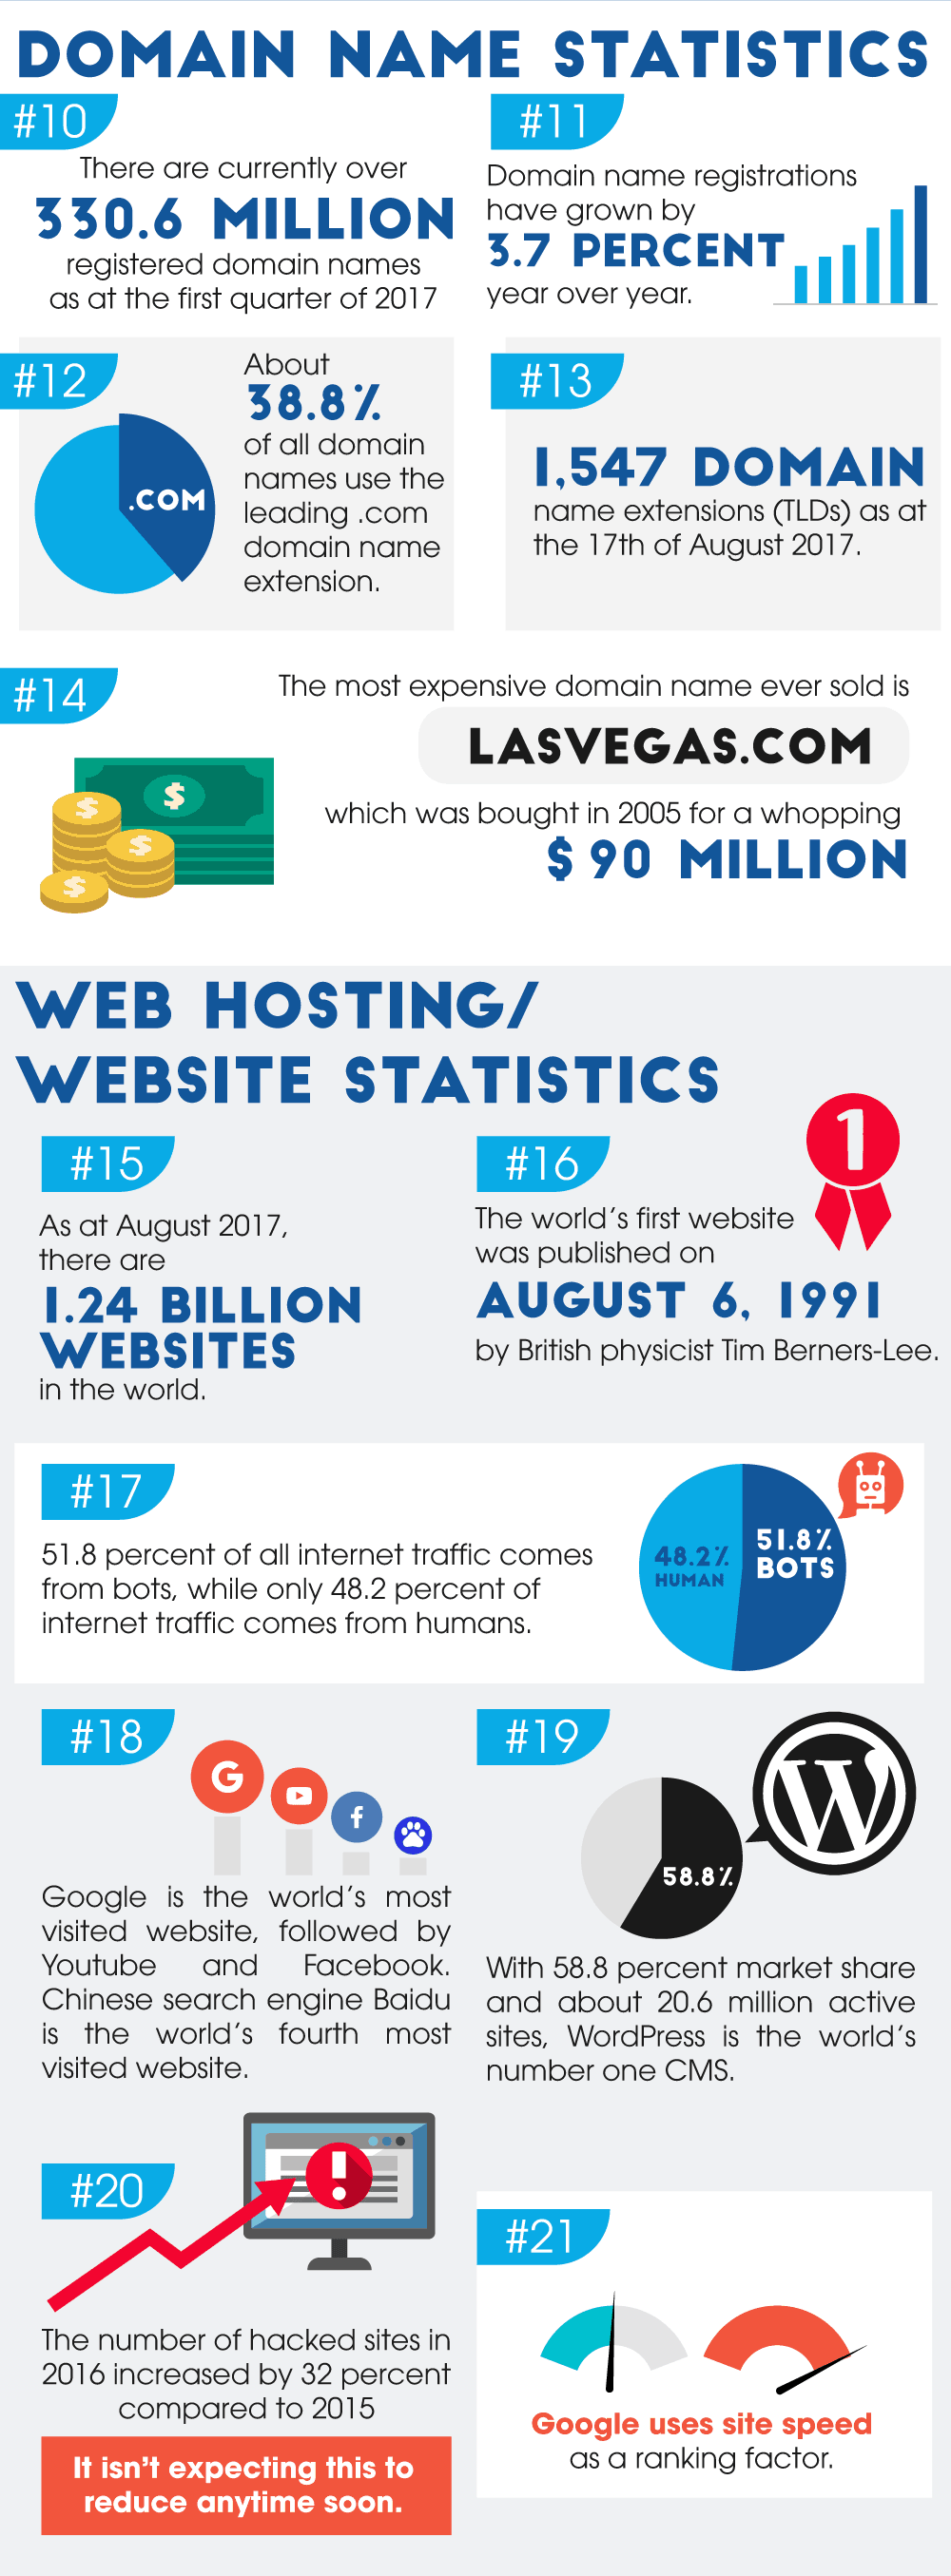
- Having a hard time finding a domain name that’s not taken? The more than 330.6 million domain names that have been registered as of 2017’s first-quarter may explain why. But worry not, we’ve created a list of domain name generators that can help you.
- There has been a 3.7 percent annual increase in the number of domain name registrations.
- The .com domain name extension is the most popular, accounting for approximately 38.8 percent of all domain names.
- By August 17, 2017, the number of domain name extensions reached 1,547.
- At $90 million, the domain name Las Vegas.com, purchased in 2005, is the most costly domain name to ever be sold.
Web Hosting/Website Statistics and Facts 2025
- By August 2017, the number of websites in the world reached 1.24 billion.
- Tim Berners-Lee, a British physicist, is credited with publishing the world’s first website on August 6, 1991.
- Humans account for a mere 48.2 percent of Internet traffic with bots accounting for the remaining 51.8 percent of traffic.
- The top three most visited websites in order are Google, YouTube, and Facebook. Baidu, a Chinese search engine, comes in at number four.
- The world’s number one CMS is WordPress, which was created in 2004. It boasts an impressive 58.8 percent market share and includes more than 20 million active sites, Forbes, The New York Times, and Facebook.
- The 32 percent increase in hacked sites seen between 2015 and 2016 is not expected to decline according to Google. To that end, check out this guide on how to on secure WordPress from hackers.
- Site speed is what Google uses as a ranking factor.
E-Commerce and Conversion Statistics 2025

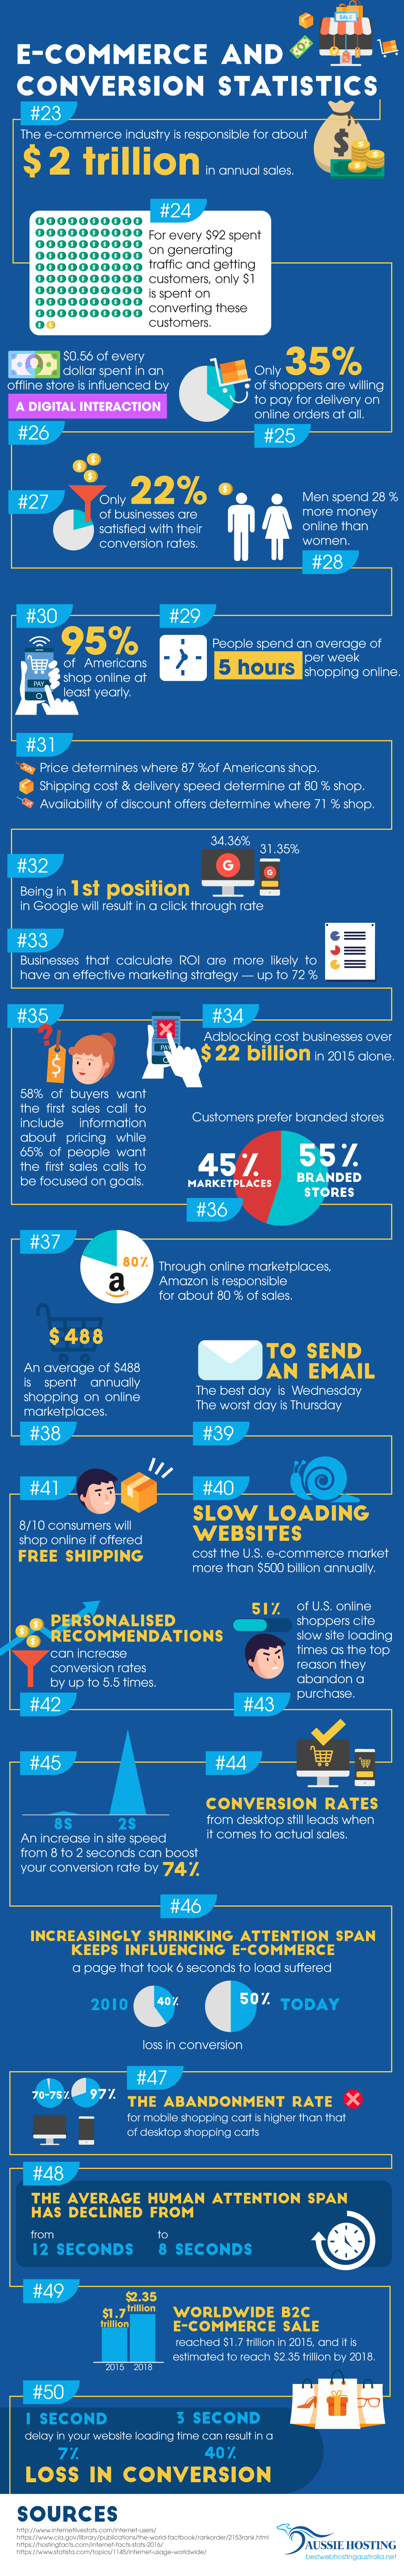
 E-commerce accounts for approximately $2 trillion in yearly sales.
- Just $1 out of every $92 spent generating traffic goes to converting customers.
- The majority of shoppers, approximately 65 percent, refuse to pay for shipping when they order online. Only 35 percent are willing to pay to have their online order shipped.
- Digital interactions influence $0.56 of every dollar used to purchase items or services at a brick-and-mortar store.
- Seventy-eight percent of businesses are unsatisfied with their conversion rates.
- Men’s spending online outpaces that of women by 28 percent.
- An average person will spend five hours weekly doing online shopping.
- Every year 95 percent of Americans shop online.
- Eighty-seven percent of Americans make their shopping decisions based on price. Eighty percent make the decision based on the price of shipping and the speed of delivery. And 71 percent decide where to shop based on the availability of discount offers.
- Having the top spot in a Google results leads to a 34.36 percent click through rate on desktops and a 31.35 percent click through rate on mobile devices.
- If a business calculates its return on investment, there is a 72 percent chance that they’re going to have a marketing strategy that is effective.
- In 2015 alone, business revenue was affected to the tune of $22 billion as a result of ad blocking.
- Sixty-five percent of people would like the first sales calls to be goal focused. Only 58 percent want that first sales call to discuss pricing.
- Branded stores account for 55 percent of e-commerce sales. The remaining 45 percent happen via marketplaces.
- Eighty percent of online marketplace sales took place through Amazon.
- On average people spend $488 every year shopping at online marketplaces.
- Thursday is the worst day to send email. Wednesday is the best.
- Did you know that the US e-commerce market loses half $1 trillion every year because of slow loading websites? Check out these web hosting reviews if you want to find a reliable host.
- Eighty percent of customers will shop online if the shipping is free.
- Conversion rates can be increased by a factor of 5.5 if personalized recommendations are offered.
- Slow loading websites were cited by 51 percent of US online shoppers as the reason why they abandon a purchase.
- Although a lot of people use their mobile device to access the Internet, those who use a desktop or a tablet are more likely to purchase. It’s estimated that 8.52 percent of individuals who visit the site on their desktop put something in their cart, with 2.78 percent of these individuals actually purchasing. Comparatively, 4.7 percent of smartphone users will add something to their cart, with only 0.80 percent actually purchasing. These latter numbers may be slightly higher when you look at tablets and all other mobile devices, but when it comes to converting and making sales, desktop is still the leader.
- Increasing your Internet site speed from eight seconds to two seconds may lead to a 74 percent increase in conversion rate, according to the activity monitored by 33 big-name retailers.
- Many people have a shorter attention span. In 2010, a webpage that needed six seconds to load had a 40 percent decrease in conversion. Today, that same six seconds will lead to a 50 percent conversion loss.
- Ninety-seven percent of mobile shoppers abandon items in their cart. Only 70 to 75 percent of desktop shoppers do the same.
- In 2000, an average person’s attention span was 12 seconds. Now, it’s only eight seconds. To put this in perspective, a goldfish has an attention span of nine seconds. This information came to light after Microsoft Corp. did a survey of more than 2,000 individuals, as well as monitored another 112 individual’s brain activity using EEGs.
- In 2015, B2C worldwide e-commerce sales were approximately $1.7 trillion. By 2018, it’s expected to exceed $2.35 trillion.
- If your website delays in loading for just one second, you’ll likely see a seven percent conversion loss. Forty percent of your visitors will abandon your site if they have to wait three seconds for it to load.
Shout out to Kani! Our awesome infographics designer who made this!
For more info check out our best web hosting reviews!